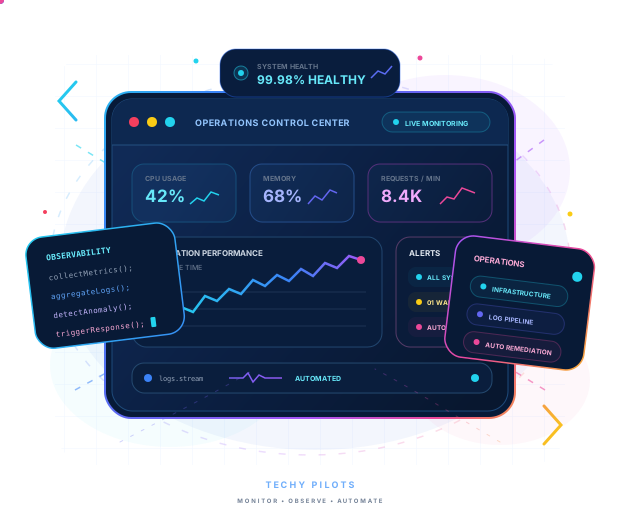
Create visibility across infrastructure, applications, services, logs, metrics, and traces.
Alert
Detect actionable issues and notify the right teams before they become larger incidents.
Remediate
Automate repetitive recovery and operational tasks to reduce manual intervention.
Improve
Use operational data to continuously improve reliability, performance, and availability.
Observability & Operations
Turn operational data into faster decisions
Modern applications depend on distributed infrastructure, containers, databases, APIs, cloud services, and networking. Without effective observability, diagnosing problems can become slow and complicated.
We build monitoring and operations platforms that provide actionable visibility into your systems while automating repetitive operational activities and incident response.
Our Monitoring & Operations Services
Complete visibility across your technology environment
Monitor infrastructure, applications, containers, databases, and cloud services while automating operational processes.
Monitor AWS, Azure, and Google Cloud infrastructure using centralized metrics, logs, alerts, and operational dashboards.
AWS monitoring
Azure monitoring
Google Cloud monitoring
Cloud service health
Operations Automation
Automate repetitive operational activities such as health checks, service restarts, cleanup tasks, notifications, and remediation.
Scheduled operations
Automated remediation
Service management
Operational scripts
Observability
Understand what is happening across your systems
Effective observability combines multiple sources of operational data to help engineering teams understand system behavior.
Metrics
Measure CPU, memory, latency, throughput, errors, capacity, and application performance.
Logs
Centralize application and infrastructure logs to simplify troubleshooting and operational analysis.
Traces
Follow requests across distributed services to identify bottlenecks and service dependencies.
Events
Correlate deployments, infrastructure events, incidents, and system changes with application behavior.
Automated Operations Lifecycle
Detect. Diagnose. Remediate. Improve.
Connect monitoring and operational automation to create a faster, more reliable incident management process.
Detect
Continuously monitor systems and identify abnormal behavior, failures, performance degradation, and availability issues.
Alert
Route actionable alerts to the appropriate teams while reducing unnecessary notification noise.
Diagnose
Use metrics, logs, traces, dashboards, and service dependencies to identify the root cause.
Remediate
Automate common recovery and remediation actions to reduce manual operational work.
Improve
Use operational data and incident history to continuously improve reliability and performance.
Monitoring Technology Stack
Modern tools for observability and operations
We design monitoring architectures around your application stack, infrastructure, operational requirements, and existing technology investments.
Prometheus
Grafana
OpenTelemetry
ELK Stack
Elasticsearch
Logstash
Kibana
Loki
Jaeger
Alertmanager
AWS CloudWatch
Azure Monitor
Google Cloud Monitoring
Datadog
New Relic
Docker
Kubernetes
Linux
Business Impact
Build more reliable operations
Effective monitoring gives teams the information they need to detect problems early, investigate incidents quickly, and improve system reliability over time.
Faster incident detection
Reduced mean time to recovery
Improved infrastructure visibility
Centralized logs and metrics
Better application performance
Reduced operational workload
Automated incident response
Improved service reliability
Operational Capabilities
Monitoring designed around measurable outcomes
Reduced MTTR
Detect and diagnose incidents faster with centralized observability and automated operational workflows.
Better Reliability
Continuously monitor service health and infrastructure performance to improve availability.
Operational Visibility
Give engineering and operations teams a single view of infrastructure, applications, and services.
Automated Response
Automate repetitive remediation tasks and operational workflows to reduce manual intervention.
How We Work
A practical approach to monitoring automation
We focus on actionable monitoring rather than simply collecting large volumes of telemetry.
01
Assess
Review your infrastructure, applications, existing monitoring, alerting, logs, incidents, and operational processes.
Continuously improve alerts, dashboards, operational workflows, reliability, and system performance based on real-world data.
Service Health
Monitor application and infrastructure health continuously with meaningful service-level indicators and health checks.
Incident Prevention
Identify abnormal trends, resource saturation, application errors, and performance degradation before they become major incidents.
Operational Runbooks
Convert common operational procedures into documented and automated runbooks for consistent incident response.
FAQ
Monitoring & operations questions
What is monitoring and operations automation?
Monitoring and operations automation combines infrastructure and application monitoring with automated alerting, incident response, health checks, remediation, and operational workflows.
What can you monitor?
We can monitor servers, cloud infrastructure, applications, APIs, databases, containers, Kubernetes clusters, networking, storage, and other critical services.
Do you support AWS, Azure, and Google Cloud?
Yes. Monitoring architectures can be implemented across AWS, Microsoft Azure, Google Cloud, hybrid environments, and multi-cloud infrastructure.
Can you centralize application and infrastructure logs?
Yes. We can design centralized logging solutions that collect logs from applications, servers, containers, Kubernetes, and cloud services for easier search, analysis, and troubleshooting.
Can monitoring trigger automated remediation?
Yes. Appropriate alerts can trigger automated operational workflows such as service recovery, health checks, scaling actions, notifications, or predefined remediation procedures.
Share this article
Help others benefit from these insights by sharing this article with your professional network.
Ready to improve your cloud operations?
Build reliable monitoring, observability, alerting, and automated operational workflows that help your teams detect and resolve problems faster.